Loading an OBO ontology into a networkx graph#
Ontology are commonly represented as knowledge graphs, and the OBO language can express an ontology as an RDF graph, with terms as nodes and relationships as edges.
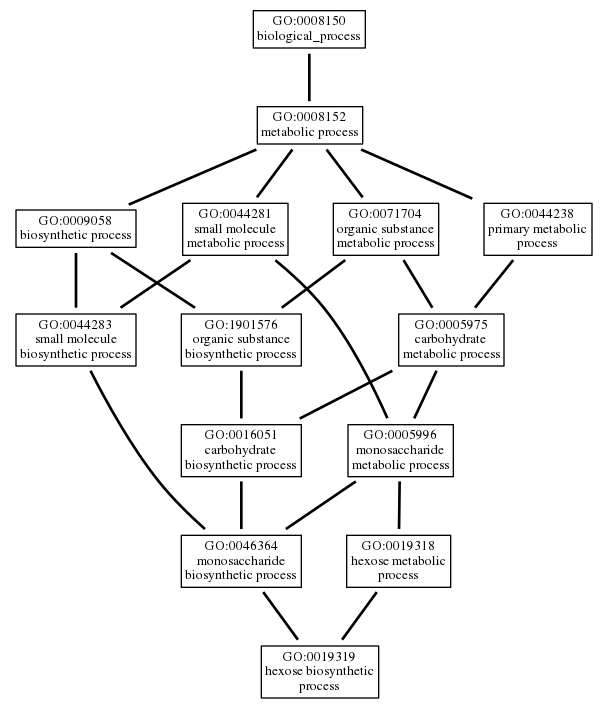
As an example, here is how the hexose biosynthetic process and its superclasses in the Gene Ontology can be represented as a graph, with edges showing the rdfs:subClassOf relationships:
fastobo can be used to load the data from an OBO document and to build a graph using NetworkX, a graph library for Python. For this example, we will use the Phenotype And Trait Ontology. Let’s start by creating an empty DiGraph:
[1]:
import networkx
knowledge_graph = networkx.DiGraph()
To load the latest version of PATO, we can use the Persistent URL form the OBO library which always resolves to the most up-to-date version:
[2]:
import urllib.request
import fastobo

with urllib.request.urlopen("http://purl.obolibrary.org/obo/pato.obo") as response:
    pato = fastobo.load(response)
Now, we can populate the knowledge graph with all the terms that were just loaded, and add a link for every is_a clause appearing:
[3]:
for frame in pato:
    if isinstance(frame, fastobo.term.TermFrame):
        knowledge_graph.add_node(str(frame.id))
        for clause in frame:
            if isinstance(clause, fastobo.term.IsAClause):
                knowledge_graph.add_edge(str(frame.id), str(clause.term))
Most OBO ontologies are DAGs, and PATO should be one as well:
[4]:
networkx.is_directed_acyclic_graph(knowledge_graph)
[4]:
True
Now, we can have a look at only a portion of the graph, just like in the GO term example. Let’s use networkx.descendants to extract the superclasses of an arbitrary PATO term:
[5]:
superclass_nodes = networkx.descendants(knowledge_graph, "PATO:0000297")
superclass_nodes.add("PATO:0000297")
super_graph = knowledge_graph.subgraph(superclass_nodes)
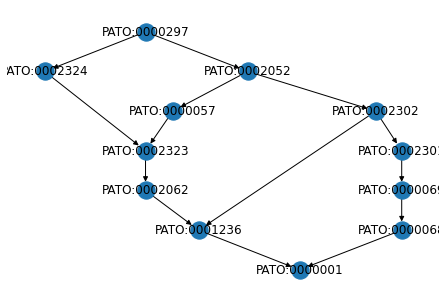
We can then draw the subgraph of PATO:0000297 and its superclasses using the drawing capabilities of networkx:
[6]:
from networkx.drawing.nx_agraph import graphviz_layout
networkx.draw(super_graph, pos=graphviz_layout(super_graph, prog="dot"), with_labels=True, arrows=True)